How to Build an SEO Client Report That Prevents Churn

Agencies often lose retainer accounts right when their organic campaigns finally start gaining traction. You might've delivered excellent results this month, but if the client doesn't see them clearly, they won't stick around. A compelling SEO client report communicates the business value of organic search campaigns to stakeholders. An effective report highlights goal progress, essential KPIs, actionable insights, and the direct ROI of your agency's work, rather than just listing rankings and traffic.
The digital marketing industry loses accounts constantly. The average annual client churn rate for digital marketing agencies is roughly 22%, with retainer-based agencies averaging 18% annual churn and project-based agencies seeing up to 42% churn. We see this disconnect happen almost every day. An account manager delivers a 20-page monthly PDF filled with keyword rankings and traffic graphs. The client stares at the charts, complains they don't understand the value of the retainer, and cancels the contract. The agency executed the technical strategy perfectly. They just failed the communication test.
We offer a complete framework for building scalable reporting workflows that prioritize strategic storytelling over raw data dumps. You'll learn how to automate data collection, tie organic metrics directly to client revenue, and turn your monthly update into your strongest retention asset.
Quick Takeaways
- An effective SEO client report is a strategic storytelling tool that translates raw organic search data into undeniable business value, proving your agency's direct impact on the client's bottom line.
- Stop delivering uninterpreted data dumps; always frame technical fixes and vanity metrics in plain business English to show how they resolve sales friction and drive revenue.
- Protect your agency from early churn by proactively establishing leading indicators, such as search impressions and keyword momentum, to demonstrate campaign traction before lagging revenue metrics materialize.
- Standardize your core narrative structure across all accounts to eliminate manual data entry, reclaim unbillable administrative hours, and significantly increase agency profitability.
- Build unbreakable client trust by relying exclusively on transparent, first-party performance data rather than inflated volume estimates that set unrealistic expectations.
- Use negative metric fluctuations as a demonstration of competence by identifying underperforming content and presenting a clear, data-backed diagnostic action plan before the client even asks.
The strategic purpose of an SEO client report
We typically see agencies treat monthly reporting as a receipt of services rendered. They compile a list of tasks completed, attach a spreadsheet of rank movements, and email it off. That approach fundamentally misunderstands what the client is buying.
Moving from data dumps to strategic storytelling
Your client isn't paying for optimized meta tags or backlink outreach. They're paying for business growth. When an account manager hands over a massive PDF of keyword fluctuations, it forces the client to interpret what those numbers mean for their revenue. Most business owners can't make that leap. Frustration sets in quickly.
A strong report is the primary retention mechanism for your agency. It shapes the narrative around the data. A narrative-driven update skips stating that organic traffic increased by ten percent and explains that the newly captured traffic aligns perfectly with the client's high-margin service pages. It positions the brand to capture more qualified leads next quarter. The former is an uninterpreted data point. The latter is a business case for renewing the contract.
Strategic storytelling means giving the numbers context. If traffic drops, the report should explain why and outline the exact steps the agency is taking to recover it. If traffic spikes, the report should identify the specific cluster driving the growth and propose a plan to double down on that success. The data is simply the foundation. The value lives in the agency's interpretation of that data.
Managing expectations through the natural SEO timeline
Organic search takes time. It takes an average of 3 to 6 months to see significant, noticeable results from an SEO campaign. If you don't communicate that reality proactively, your client will expect immediate returns and label the campaign a failure by month two.
We recommend setting these expectations in the very first onboarding document and reinforcing them in every subsequent update. The monthly report is an ongoing education in how search works. Remind stakeholders where they are in the timeline. Show the leading indicators early in the engagement. Highlight impressions growing before clicks, or keywords moving from page three to page two. Frame these early shifts as intentional progress to prevent panic.
When you map the reporting structure to the natural maturity curve of a campaign, you protect your team from unrealistic demands. Month one reporting might focus entirely on technical fixes and indexation. Month three shifts to impression growth and initial SERP feature captures. Month six finally transitions to conversion metrics and revenue attribution. This evolution keeps the client engaged and patient.
Tying technical organic wins to business impact
Technical metrics matter to your team, but they are only supporting evidence for the client. When you capture a featured snippet, the client doesn't care about the structural markup that earned the placement. They care about the result.
Translate the technical win into business language. Explain that capturing that SERP feature means their brand now answers a high-intent question before competitors even get a chance to speak. Connect the optimization work to the broader business goals discussed during the pitch. We've found that clients rarely argue over budget when they clearly understand how a specific technical fix directly protects or grows their bottom line.
The same rule applies to site speed or architecture improvements. Don't just report that you minimized render-blocking resources. Explain that the faster load time directly improves the mobile checkout experience, reducing the friction that previously cost them sales. Tell the story. Make it undeniable. Every technical task on your agency's timesheet should map back to a business outcome the client values.
Standardizing reports to protect agency margins
There's an internal strategic purpose to reporting as well: profitability. When every account manager builds bespoke reporting decks from scratch, the agency loses unbillable hours. You can't scale a consultancy if your team spends the last week of every month manually formatting spreadsheets.
A standardized core narrative structure across all clients protects your margins. The specific data changes, but the framework—executive summary, leading indicators, conversion metrics, and next steps—remains identical. This frees your team to focus their energy on the analysis.
Essential SEO metrics and KPIs for client retention
The right numbers matter just as much as how you frame them. If you focus entirely on metrics that don't pay the bills, you'll eventually lose the account.
The right metrics allow you to connect search visibility directly to the client's bottom line.
Distinguishing vanity metrics from ROI
Traffic is a means to an end. We've seen countless reports celebrating spikes in site visitors that generated zero new business. If the client runs a local plumbing service, a viral blog post that brings in thousands of international readers looks great on a line graph but does nothing for their revenue. You have to look at the actual conversion data.
The typical organic search conversion rate hovers around 2.4%. When broken down by business model, B2B companies average an organic conversion rate of 1.1%, while B2C organizations see a higher average of 2.5%. To prove value, you need to track how well your traffic meets or exceeds these baselines.
Google Analytics 4 is the default standard here. It uses an event-based measurement model across web and app platforms, making it easier to track specific user interactions. Map your organic traffic segments to specific conversion events—whether that means form submissions, phone calls, or e-commerce checkouts. Show the client the ROI.
Sometimes, standard conversion tracking breaks down. Cross-domain tracking fails, or a client uses a legacy CRM that loses attribution data. In these situations, we recommend establishing proxy metrics to demonstrate value. Track micro-conversions like newsletter signups, whitepaper downloads, or time spent on key service pages. Demonstrate that the organic channel is delivering highly engaged users into the top of their funnel, even if the final sale happens offline.
Setting up leading versus lagging indicators
A common trap in agency reporting is focusing entirely on lagging indicators like total revenue or closed deals. While these are the ultimate goal, they take months to materialize in an organic campaign. If you only report on closed revenue in month two, your report will look like a failure.
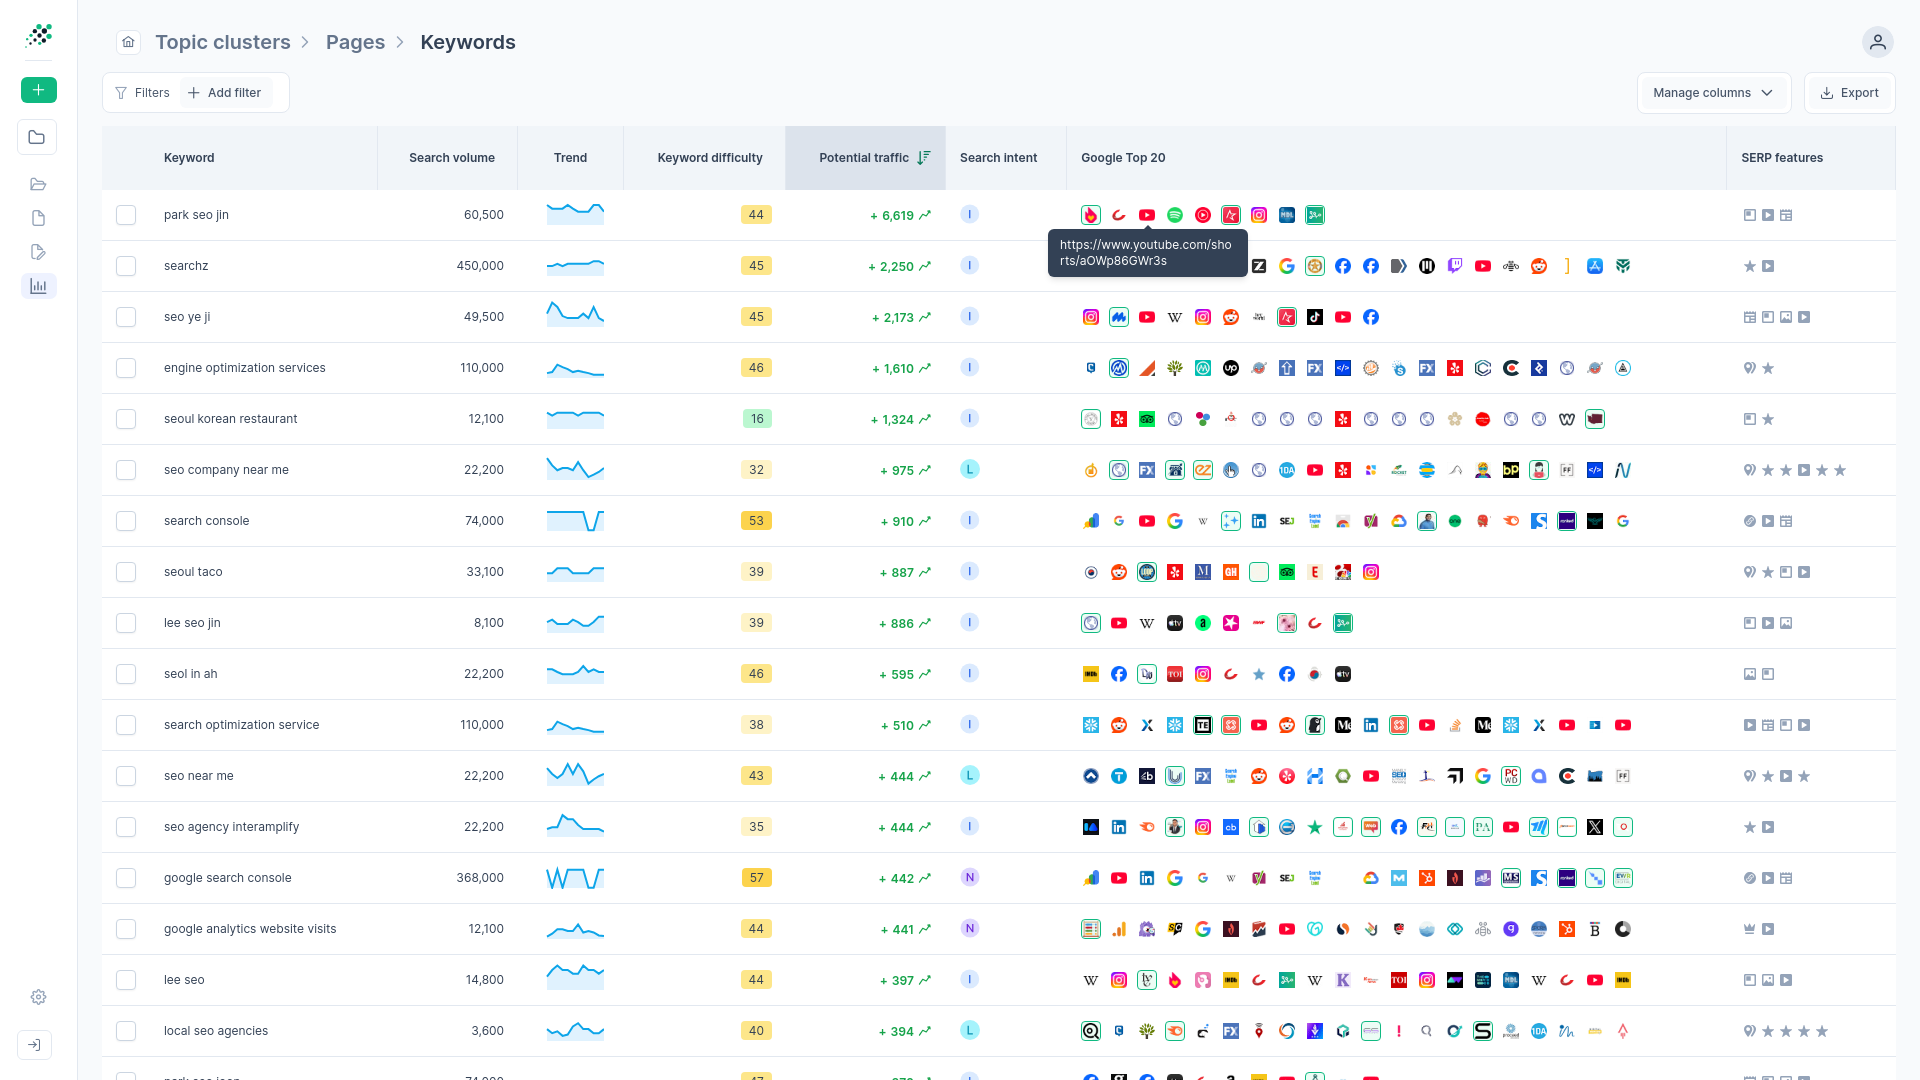
You'll need to establish leading indicators to prove early traction. Search impressions are your primary leading indicator. Before a page earns clicks, it must earn impressions. Show the client how your new content clusters are rapidly gaining visibility in the search results.
Keyword momentum is another strong leading indicator. Highlight the number of keywords moving from page three to page two. This demonstrates that Google is responding to your optimization efforts and testing the content higher in the index. When framed correctly, these movements buy your agency the time needed to achieve the lagging revenue results.
Using Search Console for transparent progress
Clients want to know the data you present is real. Third-party tools can sometimes create skepticism, especially if the numbers fluctuate wildly from month to month due to proprietary estimation models.
We usually anchor our reporting in Google Search Console because it provides first-party website performance data directly from the source. It tracks search performance metrics like clicks, impressions, and rankings without the estimation layers found in other software. When you pull data straight from the client's own property, it builds strong trust. They can log in and verify the numbers themselves.
This approach is built directly into the RankDots platform. You can connect a different Google Search Console property for each client via OAuth. The data flows directly from the client's own account, so clients can independently verify any metric you report. Complete transparency eliminates doubt.
Beyond basic traffic, Search Console provides a great opportunity to highlight technical health improvements over time. A steady decline in crawl errors or an improvement in Core Web Vitals scores proves your agency is actively maintaining the site's foundation. Core Web Vitals provide a standardized way to look at real-world user experience elements like loading performance and visual stability. These translated technical scores help clients understand the value of your ongoing maintenance work, even during months when ranking movements are quiet.
Diagnosing content underperformance
Eventually, you'll hit a quarterly review where a client demands to know why certain pages aren't driving traffic despite ranking well. The tension in the room spikes. They want a fix, and they usually want it without approving a large new budget for link building.
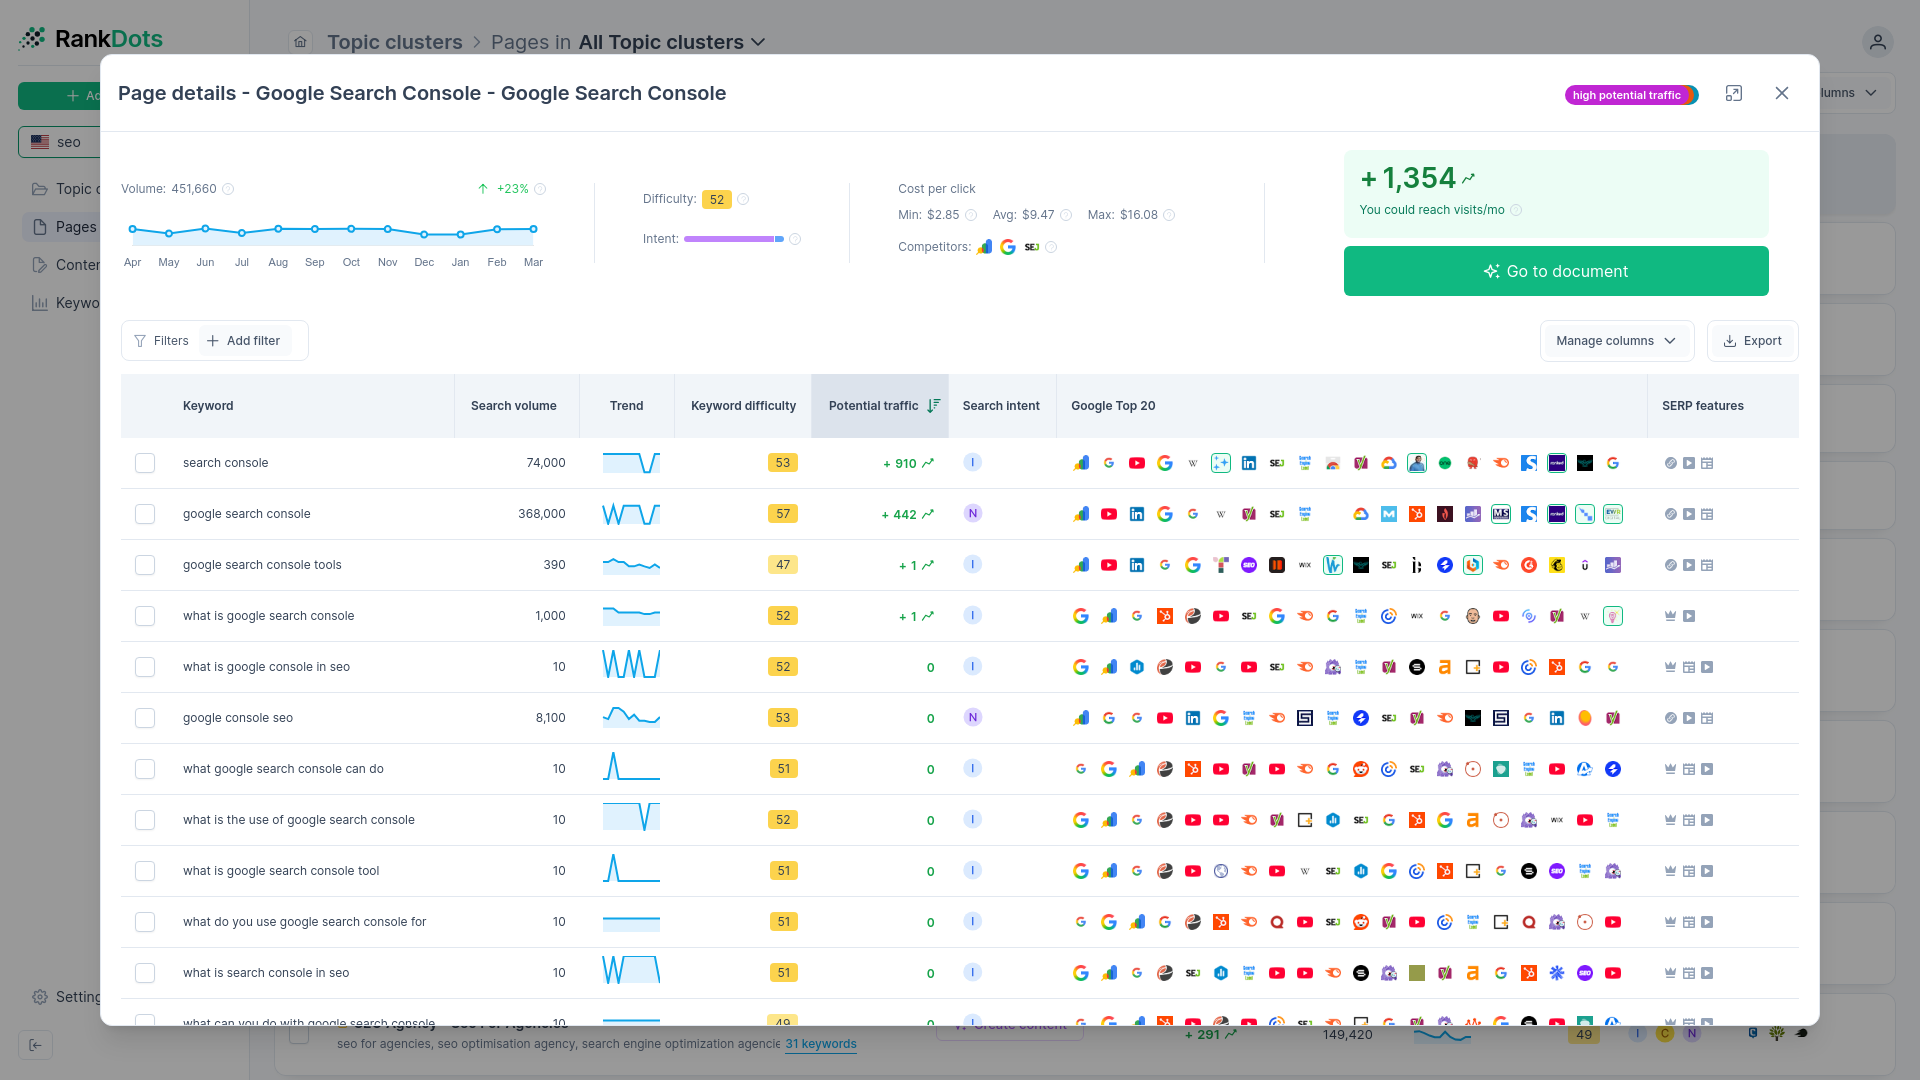
This is where a proactive diagnostic approach saves the relationship. Lean into the data to find the bottleneck. We often use the Content Underperformance Diagnosis workflow inside RankDots for exactly this scenario. We overlay the client's Google Search Console data directly onto keyword opportunity metrics to isolate the exact breakdown and present an immediate action plan.
If a page shows high impressions but a low click-through rate, the content is visible, but the title and meta description aren't compelling enough to win the click. That's a quick, low-cost optimization win. You simply rewrite the meta data to better match the search intent and monitor the improvement.
When a page has high rank but low impressions, it might indicate an indexation snag, a drop in overall search demand, or a misalignment with user search behavior. These specific, actionable insights prove you're actively monitoring their investment. You aren't just reporting the weather. You're building the shelter.
A direct approach to underperformance demonstrates accountability. It shows the client that you care about the actual performance of the assets you built, not just the initial delivery. Targeted, data-backed adjustments transform a potentially disastrous quarterly review into a collaborative strategy session.
Step-by-step SEO report creation workflow
A blank presentation template on the 28th of the month usually guarantees a bad outcome. When account managers build reports from scratch, they default to downloading CSVs from rank trackers and pasting the charts without critical thought. You end up with a document that shows what happened, but ignores why it matters.
A scalable reporting process requires a strict, repeatable framework.
This consistency ensures that every account manager delivers the exact same narrative structure. The specific data will change for every client, but the sequence of information remains identical. We've seen a clear pattern in how high-retention agencies structure their deliverables: they lead with the business narrative and bury the raw data.
Review past goals to establish accountability
The fastest way to lose a client's trust is to ignore the promises you made last month. Before you pull a single metric or open a dashboard, review the previous report's "Next Steps" slide. Did your team execute the content strategy you pitched? Did the client's development team actually implement the schema markup you recommended?
Start the new report by explicitly stating those past objectives and confirming their completion status. If a goal was missed because a writer fell behind, own the delay directly. If a goal stalled because the client delayed an approval, state that neutrally. This accountability loop transforms the report from a passive data presentation into an active project management tool.
Extract the overarching narrative from raw data
Raw numbers are just ingredients. Your job is to cook the meal before serving it to the client. Before formatting any slides, review your analytics and rank tracking platforms to find the central storyline for the month.
Perhaps you notice that overall traffic is slightly down, but leads from the new service pages are up. The narrative isn't "traffic dropped." The narrative is "our strategy to filter out low-intent informational traffic and capture high-intent commercial queries is working exactly as planned."
We usually start by looking for anomalies. A sudden spike in impressions on page two of the search results indicates Google is testing new content. A drop in clicks on a historical pillar page suggests a competitor has captured a higher position. Find the two or three most impactful movements and build your entire presentation around explaining them.
Structure the executive summary for immediate ROI
Most business owners only read the first two slides of your document. If you don't prove your value within those initial pages, the rest of the report is irrelevant.
Structure your executive summary to deliver the most critical business insights immediately. Don't start with crawl budgets or broken links. Open with the exact metrics the client cares about: qualified leads, pipeline value, phone calls, or product sales directly attributed to organic search.
If the campaign is too new to show closed revenue, lead with your primary leading indicators. Show the growth in unbranded search visibility or the capture of highly competitive target queries. Tell the executive exactly what return they are getting for their retainer fee right up front. The details can wait.
Position technical health as supporting evidence
Technical SEO is critical for website performance, but it makes for terrible executive reading. We've watched endless agency pitches fail because the account manager spent twenty minutes explaining canonical tags to a confused marketing director.
Move all technical optimizations, audit scores, and routine maintenance tasks to the back half of the report. Treat this section as an appendix. It's supporting evidence to prove your team is actively maintaining the foundation, but it shouldn't drive the conversation.
When you do present technical data, attach a clear business mechanism to it. Explain that resolving those twenty 404 errors recovered lost user sessions and protected the site's path to purchase.
Define actionable next steps and resource needs
The conclusion of your report should dictate the upcoming month's workflow. Never end a presentation with a generic "thank you" slide. Use the final section to define exactly what your agency will do next and what you need from the client.
List the specific content briefs you'll deliver and the technical fixes you'll deploy. If you're blocked, state the resource requirements plainly. If you need their legal team to approve copy before publication, put that deadline on the final slide. Clear directives turn a retrospective report into a proactive strategy session.
SEO reporting tools and automation strategies
It's the last week of the month. Your account manager is desperately toggling between Google Analytics 4, a rank tracker, and a local citation tool, manually copying data into a dozen individual client spreadsheets. Deadlines slip. Mistakes happen.
Manual reporting processes create a bottleneck for scaling an agency. The administrative friction eats up dozens of unbillable hours every month. Copy-and-paste workflows guarantee that your team spends their time formatting charts instead of actually analyzing the data for strategic insights.
Automated data collection completely changes agency economics. Automation tools for SEO reporting save an average of 20 hours per month on manual data tasks. That recovered time translates directly into higher margins and the capacity to take on more retainer clients without expanding your headcount.
Automated reporting and templates also reduce manual data-entry errors and prevent missed deadlines.
Choosing between lightweight templates and BI platforms
The software you select dictates how your agency communicates. Most teams face a choice between lightweight dashboard templates and heavy business intelligence platforms. Both serve different agency models.
Tools like DashThis and AgencyAnalytics offer preset templates and full dashboard white-labeling designed specifically for digital marketing agencies.
Swydo is another viable option in this category, known for its straightforward integrations. They provide a drag-and-drop report builder and native integrations that let you spin up a passable dashboard in minutes. The tradeoff is rigidity. You sacrifice deep data manipulation for the sake of speed.
If your client roster demands complex cross-channel attribution, you might need a comprehensive intelligence layer like Whatagraph or Databox. These platforms allow for advanced data blending and custom objective tracking. Alternatively, Google Looker Studio provides an entirely free, highly customizable canvas. It integrates natively with the Google ecosystem but reportedly struggles with sluggish performance on large datasets unless connected through paid database warehousing.
Our take on tool stacks: buy only the complexity your clients will consume. A 40-page interactive dashboard in Looker Studio is useless if the client only wants to see a top-line summary of their conversions.
The necessity of transparent, un-manipulated data
Automation only works if the data itself is trustworthy. Client relationships often fracture when an agency presents metrics that conflict with the client's internal numbers.
Consider a scenario we see often: a new client is highly skeptical of your initial search volume projections. Their previous vendor promised thousands of new visitors based on inflated keyword metrics, but the actual traffic never materialized. They feel burned and defensive.
Standard keyword research software often groups similar terms together and reports the combined search volume for every individual variation. This artificially inflates the perceived market size. In fact, major third-party platforms like Semrush and Ahrefs miscalculate or inflate true search volumes by roughly 25% to 27% compared to actual user impressions.
If you base your agency's reporting on those inflated estimations, you set expectations you can never meet.
Building trust through direct integrations
The solution is removing the middleman from your core reporting. You have to anchor your monthly updates in first-party data.
We use the Transparent GSC Data Integration inside RankDots to solve the trust gap entirely. The OAuth connection to a different Google Search Console property for each client lets the platform pull first-party metrics directly from the source. When you report on clicks, impressions, and CTR, those numbers come straight from the client's own Google account.
This approach eliminates the "black box" problem. The client can log into their own property and independently verify every metric your agency presents.
RankDots also runs a Search Volume Correction Algorithm during the research phase. It identifies keywords with identical metric fingerprints and distributes the volume fairly among the variations. Accurate, realistic expectations set from the very first onboarding document prevent the exact churn scenarios that plague most agencies.
SEO Client Report Tool Capabilities Comparison
| Platform | Starting Price | Core Feature | Platform Limitation | Key Integrations |
|---|---|---|---|---|
| Reporting Ninja | Starts at $20/month | White-labeled client portal | Restricted integration library | Looker Studio, Google Sheets |
| Semrush | Starts at $139.95/month | Audits 100,000 pages monthly | Steep platform learning curve | Standalone platform |
| Ahrefs | Starts at $29/month | Competitor backlink profile analysis | Restrictive credit usage system | Standalone platform |
| SE Ranking | Starts at $129/month | Tracks 15,000 keywords daily | Missing minority market data | Standalone Data API |
Best practices for client communication and presentation
You are an agency owner walking into a kickoff meeting with a high-ticket local business. You want to establish immediate authority, but the client is defensive. Their previous vendors burned them with generic promises and vague timelines. If you spend the first hour discussing basic traffic goals or running through a standard slide deck, you look exactly like the last team they fired.
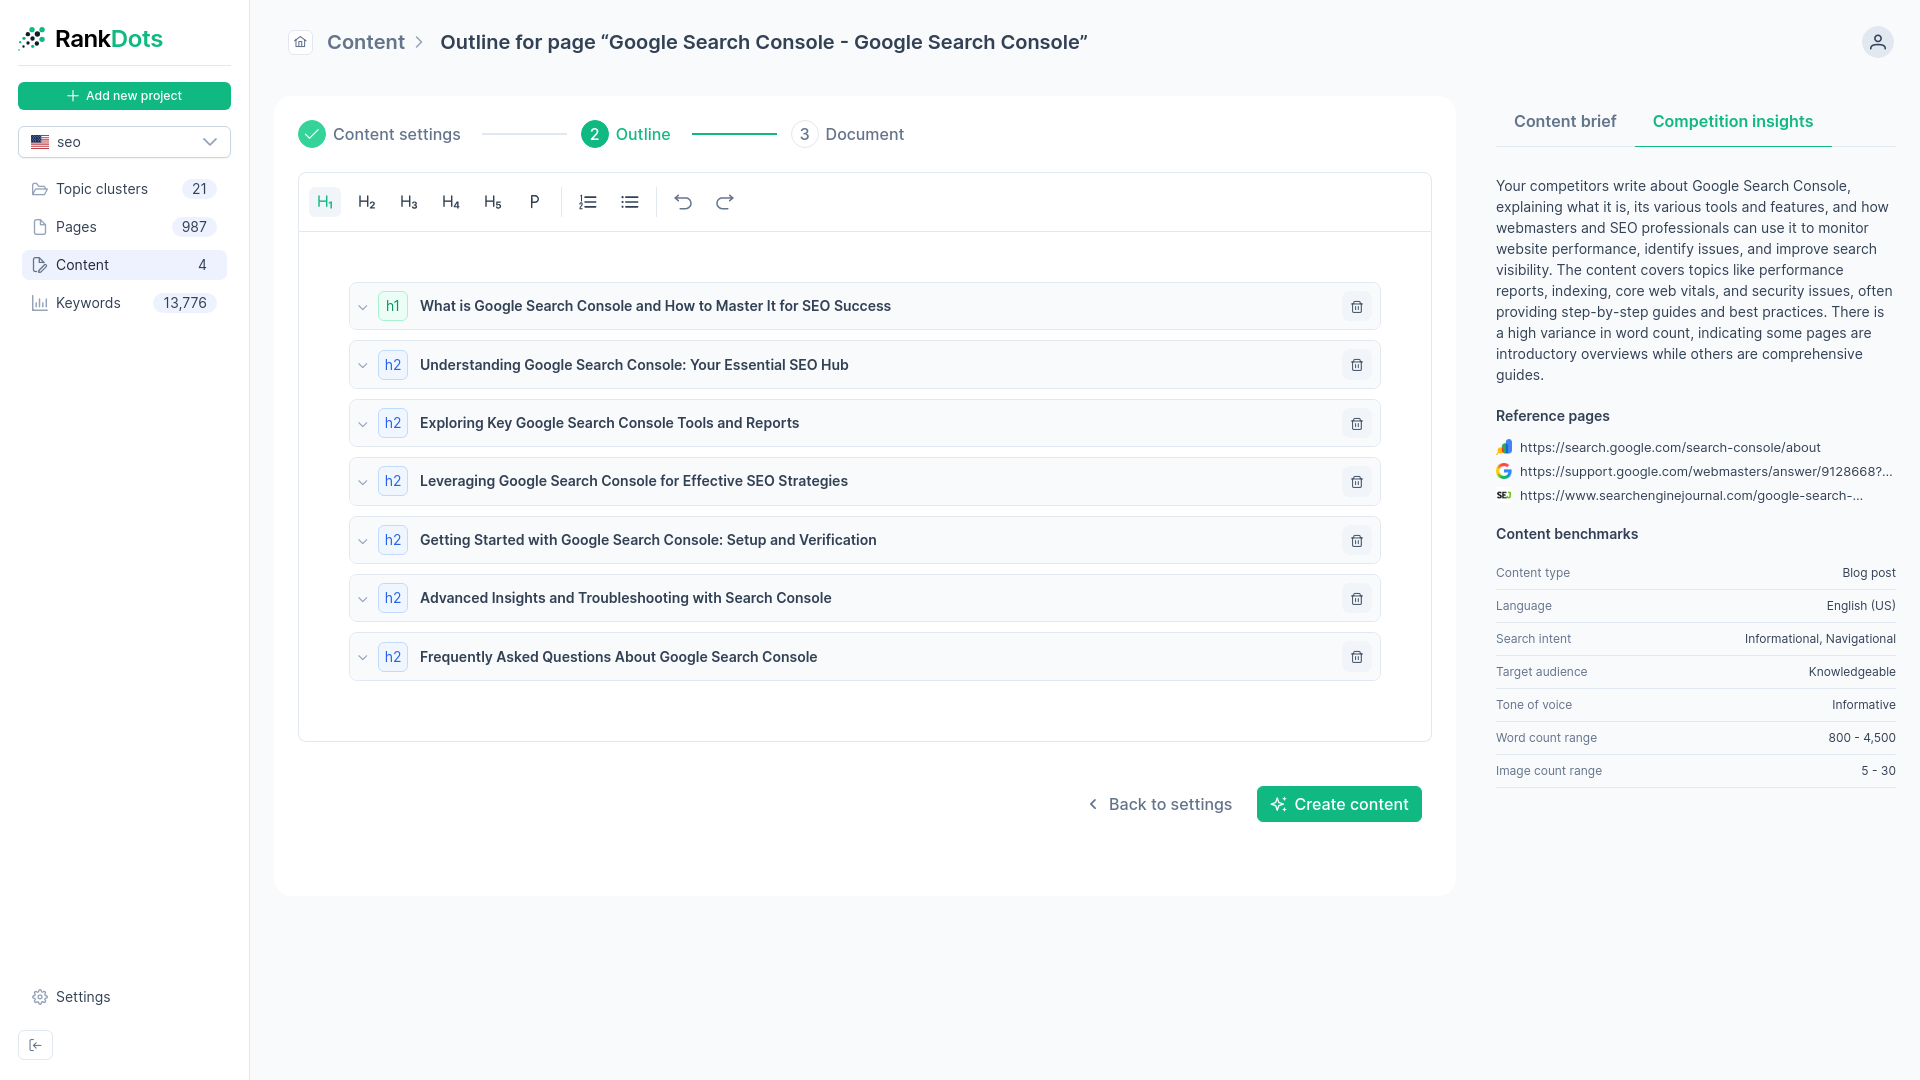
Authority requires a structural shift in how you present information from day one. A completed topic cluster map and prioritized content roadmap change the dynamic entirely in that first conversation. With the RankDots Day-One Onboarding workflow, you can generate this exact architecture before the retainer check even clears. A visual map of the competitor's exact content gaps proves you have already diagnosed their market. You aren't just selling services; you're presenting a documented strategy.
Translating technical jargon into business English
Your clients rarely care about canonical tags, render-blocking scripts, or crawl budgets. They care about friction in their sales funnel. When we review how top-performing account managers handle technical reporting, a clear pattern emerges. They never report on the optimization itself. They report on the business mechanism the optimization supports.
Imagine you just spent twenty hours fixing a complex schema markup issue on a client's e-commerce category pages. A bad report lists "Fixed JSON-LD product markup" as a completed task. The client reads that, understands nothing, and assumes you are wasting their retainer. A strategic report translates the task: "We reformatted the product page code so your star ratings and pricing now appear directly in the search results, making your listings significantly more clickable than your competitors."
Apply this translation layer to every technical metric. Page speed optimizations become "reducing the load time friction that causes mobile shoppers to abandon their carts." A fix for keyword cannibalization becomes "making sure Google only ranks the highest-converting version of your service page." Tie the technical mechanism directly to a revenue outcome, and you eliminate debates over the value of your ongoing maintenance work.
Managing the conversation around negative metrics
Rankings fluctuate constantly. Traffic drops happen. A pile of cherry-picked vanity metrics damages your credibility the moment the client eventually checks their own analytics dashboard. When a report looks entirely green for six consecutive months, business owners get suspicious—especially if their actual pipeline hasn't grown.
We typically advise addressing negative movements directly on the first slide of the report. If organic traffic dips fifteen percent month-over-month, call it out before the client even has to ask. Then, immediately explain the diagnostic process. Did a competitor publish a large new content hub? Did Google roll out a broad core algorithm update? Did the client's own development team accidentally block a critical directory during a weekend site migration?
Proactive transparency turns a metric failure into a demonstration of agency competence. You are actively managing their investment, not just delivering good news. We lean heavily on the Content Underperformance Diagnosis workflow inside RankDots for these exact conversations. If a page shows high impressions but a plummeting CTR, the data suggests the content is visible, but the title and meta description are no longer winning the click. That's an easy optimization fix. Specific, data-backed adjustments prove you're monitoring the landscape instead of making generic excuses.
Pivoting the monthly review into natural upsells
The monthly reporting presentation is the most overlooked sales channel in the agency ecosystem. The probability of successfully selling to an existing customer is between 60% and 70%, whereas the probability of selling to a completely new prospect is only 5% to 20%. You already have their attention. You already have access to their performance data. The trust is established.
Use the monthly report to reveal natural strategic gaps before you need to pitch a cold retainer expansion. When we analyze the top-ranking pages in a client's niche, we often find entire topic clusters the client hasn't even begun to target. A Topical Authority Gap analysis in the quarterly review makes the missing revenue visually obvious. You point out the specific high-intent topics competitors currently dominate.
You can also frame upsells around momentum. Sort the client's current pages to highlight "Easy Traffic Wins" where their site already out-ranks weaker domains on page two. Present these opportunities as structurally underserved positions. Offer to expand the current contract to cover a dedicated content refresh sprint for those specific pages. When you anchor the pitch in their own first-party data, the upsell feels like a natural strategic recommendation.
SEO report templates and executive summaries
A solid template forces operational discipline. When you leave report structures up to individual account managers, you generate chaotic, inconsistent deliverables. One client gets a dense spreadsheet, while another gets a minimalist slide deck. Standardized reporting formats ensure every account receives the exact same narrative flow, significantly reducing the administrative burden on your team.
Structuring a high-converting executive summary
The executive summary is the anchor for the entire document. If the primary value proposition isn't established in the first three paragraphs, the executive stakeholder will stop reading.
Start with overarching goal progress. State the primary objective agreed upon during the kickoff, then immediately display the current month's pacing toward that target. Next, highlight three strategic wins. Keep this section ruthlessly focused on business outcomes. Highlight a new lead generation milestone, a high-value keyword reaching page one, or a successful technical deployment that measurably improved conversion rates. Finally, close the summary by outlining the specific actions your agency is taking next month. This structure subtly tells the executive that you are driving the ship and actively managing the strategy.
Designing visual data hierarchies
Data visualization should guide the reader's eye directly to the ROI. Look at how sophisticated marketing platforms organize information. A unified system like HubSpot surfaces the most critical pipeline metrics at the very top of the dashboard, pulling data from its Smart CRM to show direct revenue impact before displaying granular engagement stats. Your reports should follow a similar logic.
Place the lagging indicators—revenue, qualified leads, and total conversions—at the top left of the page. Move leading indicators like search visibility and rank movement to the middle. Push technical health scores, crawl errors, and backlink counts to the bottom or into a separate appendix. This visual hierarchy forces the client conversation to start with business value. A spaghetti chart tracking fifty different keywords creates anxiety. A clean bar chart showing consistent topic cluster growth creates confidence.
Adapting complexity to the audience
A local roofing contractor requires a vastly different presentation than an enterprise marketing director. Agencies usually run into trouble when they try to use a single, bloated template for every tier of client.
For highly technical marketing teams, you likely need deep data blending, custom attribution modeling, and full data warehousing exports. They need slides they can lift directly into their own board meetings. Conversely, a local business owner finds that level of detail paralyzing. They simply want to know if the phone is ringing. In those cases, a simpler setup works best. A platform like SEOptimer provides quick, highly visual site audits that are easy for non-technical clients to digest, even if it reportedly struggles with the complex technical setups an enterprise client would demand. Match the density of the report template to the client's actual ability to interpret the data.
The standardized agency reporting checklist
To scale operations effectively, lock down the required elements. Every standard template your agency deploys should include these non-negotiable components in exactly this order:
- Executive summary. A concise, three-bullet overview covering goal progress, key strategic wins, and next month's primary focus.
- KPI scorecard. A clean, uncluttered comparison of this month's primary metrics against the previous month and the previous year to show macro trends.
- Narrative analysis. A plain-English explanation of why the metrics moved the way they did, translating the data into a business storyline.
- Content performance. A breakdown of the top-performing pages, highlighting the specific search intent behind them and any newly captured SERP features.
- Technical health snapshot. A brief confirmation that the site architecture remains sound, coupled with a list of any routine maintenance tasks completed during the billing cycle.
- Action plan. Clear, assigned deliverables for the upcoming weeks, explicitly noting any approvals or resources needed from the client's internal team.
Frequently asked questions
What should be included in an SEO client report?
How often should SEO reports be sent to clients?
How long should an SEO report be?
What is the difference between an SEO report and an SEO audit?
Turn your next SEO client report into a retention asset.
Stop wasting billable hours manually formatting spreadsheets with inflated third-party metrics. Connect directly to Google Search Console data to prove ROI and scale your agency workflows without adding headcount.